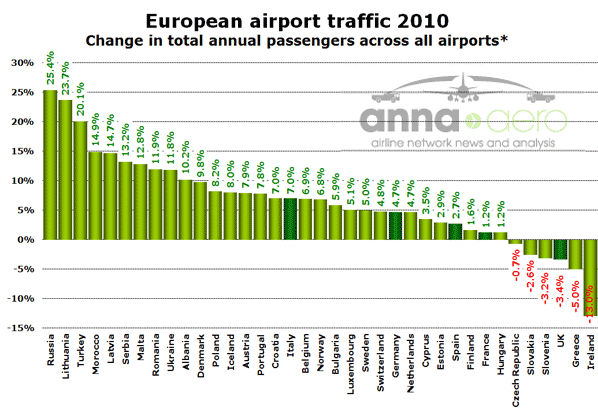
We think anna.aero�s database of traffic and trend data from some 300 European airports is the very best and biggest available indicator of what really happened in 2010 in terms of showing which countries have been most (and least) affected by recent economic and aviation developments. Significantly, the data reveals a whole picture of greater Europe, including countries such as Russia and Turkey, as well as Morocco in the periphery of the region.
With traffic data for all of 2010 now available for most of Europe�s airports, anna.aero this week takes a closer look at how different airports and countries compared during what was another difficult year for many European economies, but on the whole rather better than 2009.

Source: Various *In some cases, data for only the largest airports in a country has been used. For Russia, data is based on January-November. For Romania and Ukraine, data is based on January-September. For Slovenia, data is based on January-August.
Unlike last year, when only four of 33 countries analysed reported growth, this year all but six countries saw an increase in passenger numbers through their airports. The economic problems of Greece and Ireland are clearly reflected in their country�s airport statistics. Three of the other countries reporting a decline in air traffic demand are in Central Europe (Czech Republic, Slovakia and Slovenia), but tellingly also includes the UK, the EU�s third-largest economy and its biggest air transport market.
The UK may have been hit harder than many by the Icelandic volcano fall-out in April, coped badly with bad weather at the beginning and end of the year, and seen British Airways have its fair share of industrial problems, but this result should be considered very alarming to the UK coalition government currently trying to revive the country�s economy. The increase in APD (Air Passenger Duty) is unlikely to help improve matters in 2011.
Many of the fastest-growing countries were relatively small markets dominated by one airport, but the performances of Russia (after a poor 2009) and especially Turkey (which also grew in 2009) are particularly noteworthy.
Biggest airport winners and losers
The performance of significant commercial airports across Europe (reporting airports must have at least 100,000 passengers) varied from those where passenger numbers increased by more than 50% (three airports) to those where traffic was down more than 20% (also three airports). Below are listed the top 10 airports at both ends of the performance spectrum.
Impressively, Istanbul Sabiha G�k�en and Trapani appear in the fastest-growing airports for a second consecutive year, while Durham Tees Valley achieves the dubious distinction of being among the fastest-shrinking airports in Europe for the second year running. They are joined by three other UK regional airports (Blackpool, Humberside and Newquay), reflecting the problems in the UK market in 2010. Spanish airports accounted for three of the bottom 10 airports, with Granada, Murcia and Reus all seeing traffic fall by between 15% and 20%.
The top 10 fastest-growing airports include three in Italy, two in Morocco and two in Turkey, although the overall winner is Kaunas in Lithuania, which benefited from Ryanair making it a base in May 2010 and increasing its network from seven to 18 destinations.